
56 of Hyperliquid's 234 markets are delisted, and the API still quotes them
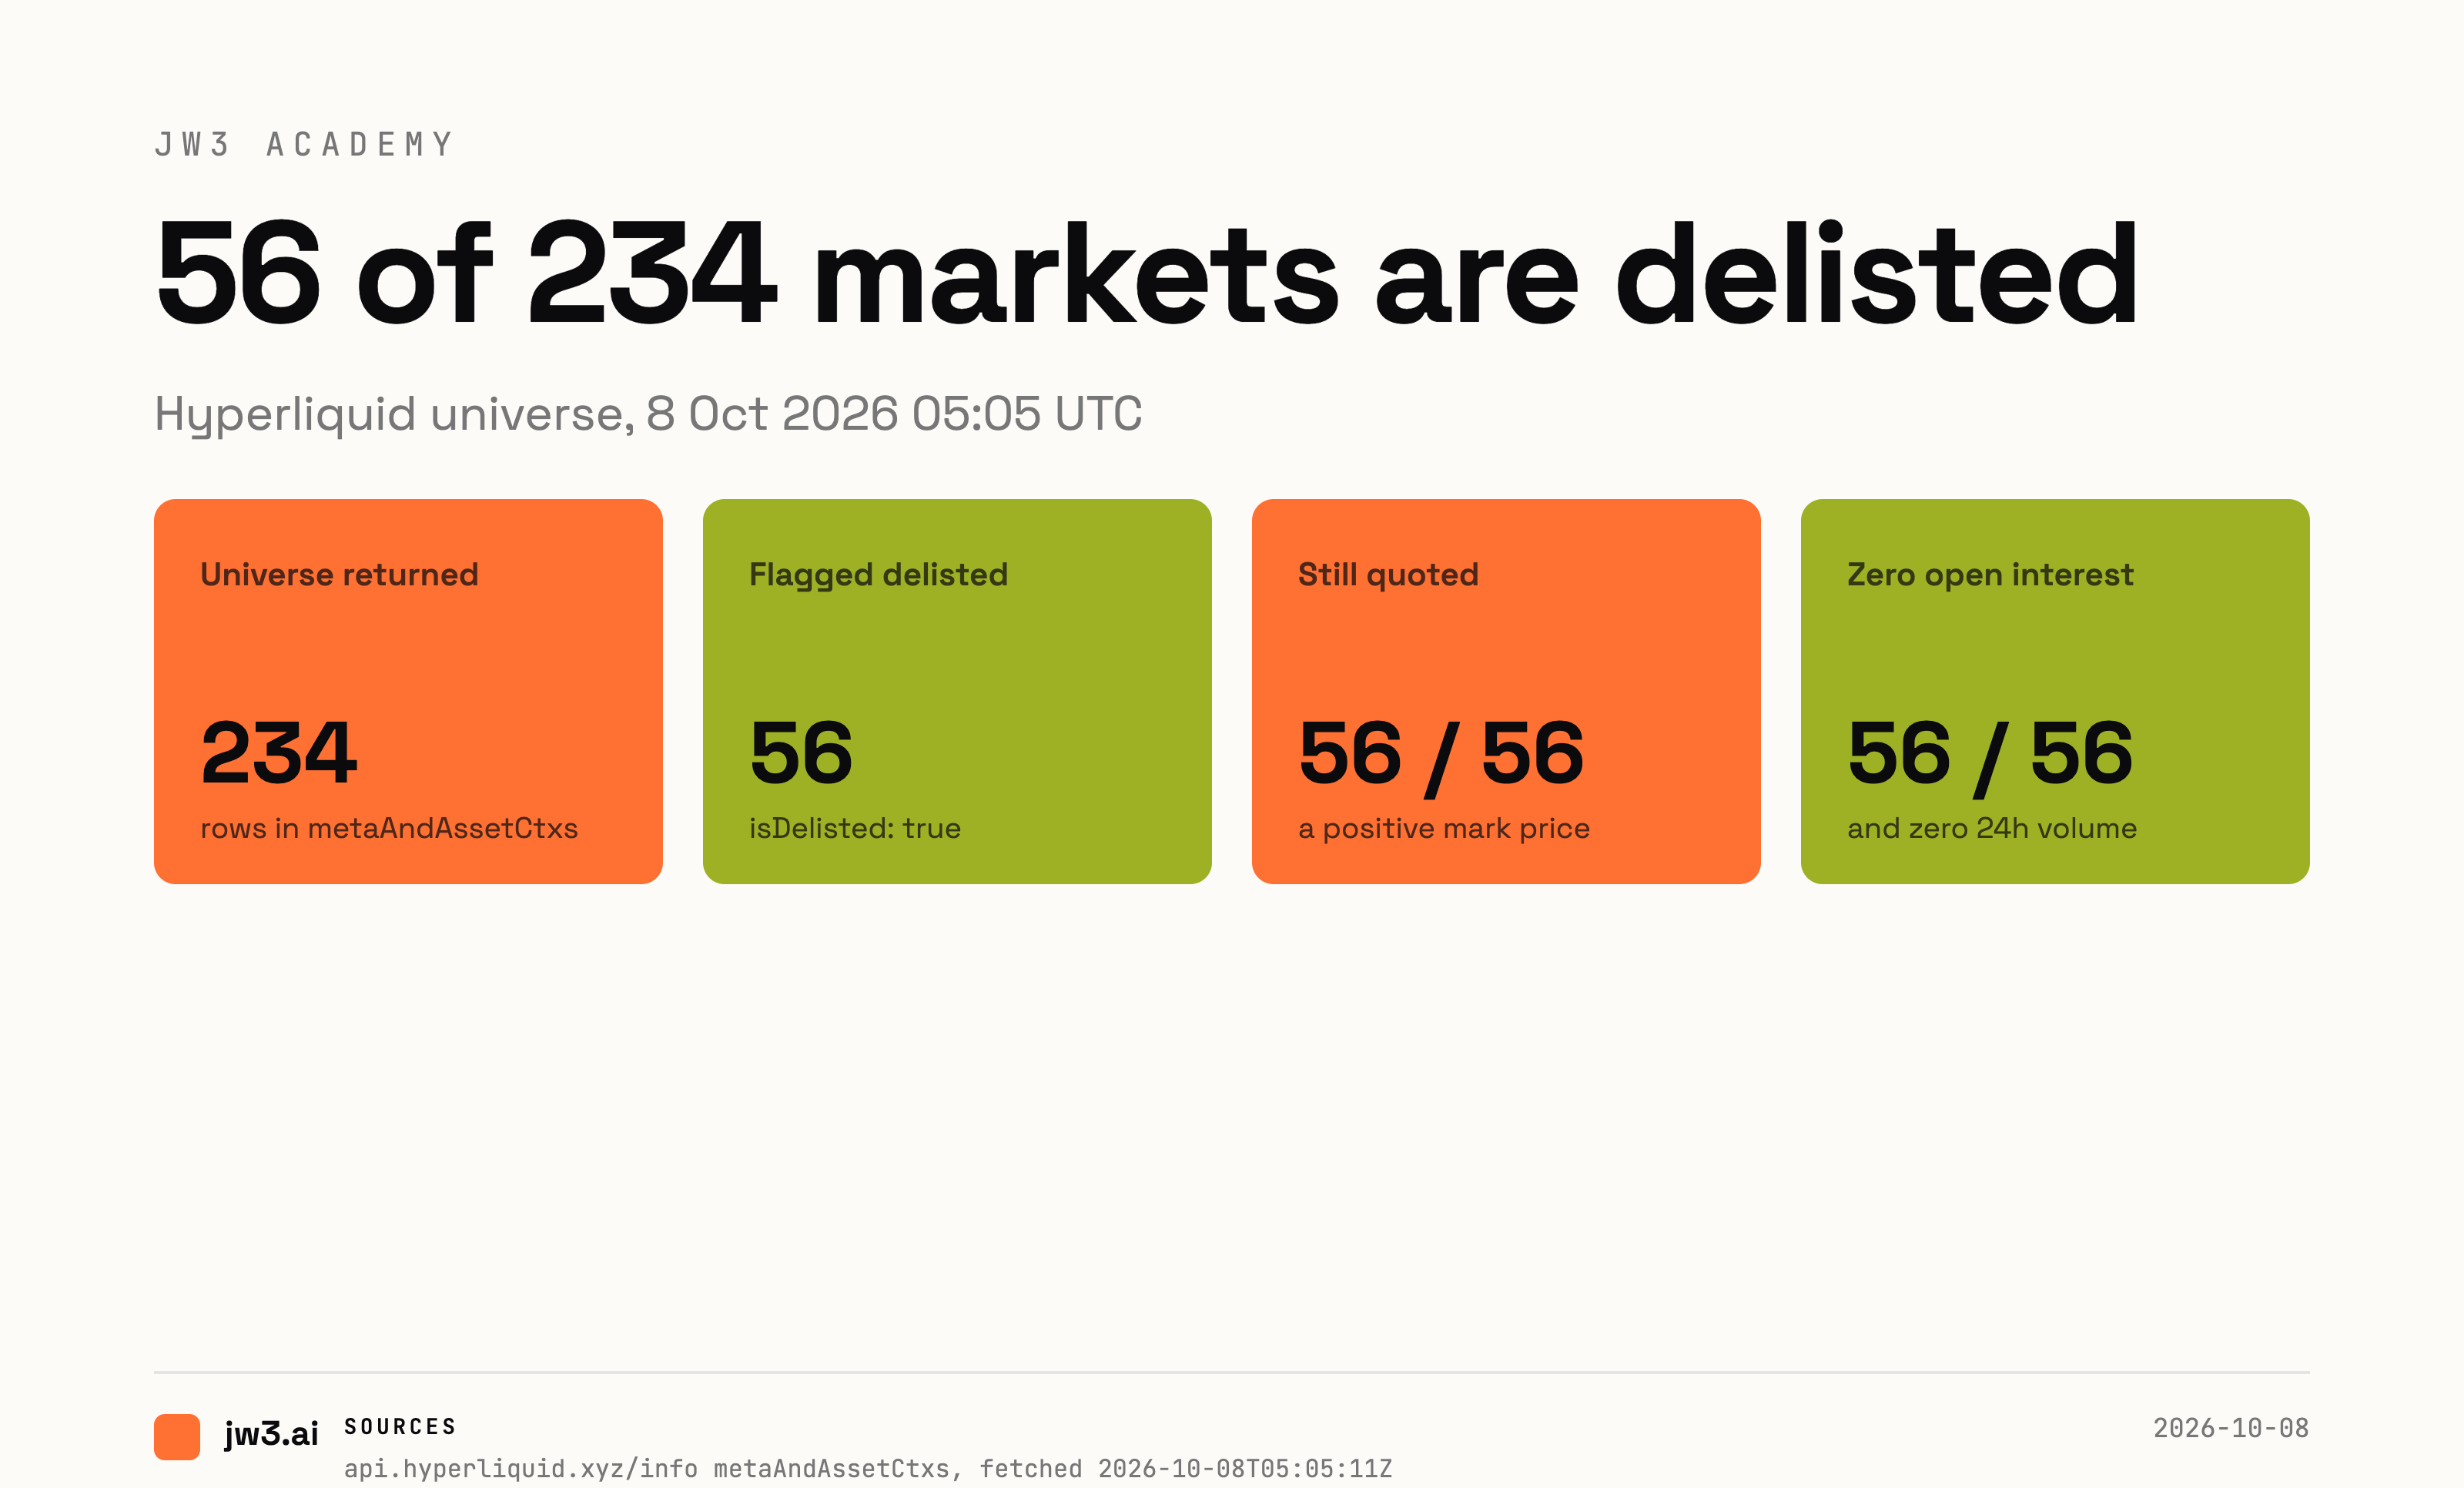
The venue's own universe list carries 234 perpetual markets. 56 of them are delisted, settled, and closed to new orders. All 56 still return a live-looking price, and a screen built on that list ranks two of them above SOL. Here is the machine-readable tell that separates them.
الترجمة غير متاحة بعد — يتم عرض الإنجليزية.
Cryptocurrency trading, leveraged perpetual futures, and automated algorithmic strategies carry significant risk of rapid and total financial loss. Never risk funds you cannot afford to lose completely.
Any screen that ranks perpetual markets starts with the same request. Ask a venue for its universe, get a list of tickers back, and every row looks like a market. The list is not the market. On Hyperliquid the gap is 56 rows wide.
The venue's POST /info endpoint returns a universe of 234 perpetual markets. Of those, 178 are live and 56 carry isDelisted: true. The 56 are settled. Positions were closed, orders were cancelled, and the venue will not accept a new one. They are still in the array, and they are still quoted.
What the endpoint returns
Read from a single snapshot at 05:05 UTC on 8 October 2026.
| | Rows | |---|---| | Universe returned by metaAndAssetCtxs | 234 | | Markets with isDelisted: true | 56 | | Live markets | 178 |
The 56 are not thin, and they are not new. Every one of them reports zero open interest and zero 24-hour volume, and the split is exact: the count of rows with zero open interest equals the count flagged delisted, 56 of 56, with no row in either category left over.
The delisting documentation describes what that state means:
When an asset is delisted, all positions are settled and open orders are cancelled. Users who wish to avoid automatic settlement should close their positions beforehand. After settlement, no new orders will be accepted.
The price that does not go away
A delisted market returning zero for volume and open interest is honest. The problem is the field next to them.
All 56 still report a positive mark price, and all 56 still appear in the allMids response with a quote. MATIC returns 0.37621. FTT returns 0.32243. Those are the last prices the venue saw before settlement, and 48 of the 56 sit within 1% of the final prevDayPx they were frozen at. Rendered in a table, a settled market and a live one are indistinguishable.
Four other endpoints give the state away, and they agree with each other:
| Endpoint | A live market (BTC) | A delisted market (MATIC) | |---|---|---| | l2Book | 200, 40 price levels | 200, 0 price levels | | candleSnapshot | 200, candles returned | 200, empty array | | fundingHistory, 7 days | 200, non-zero rates | 200, 168 rows, every rate zero | | metaAndAssetCtxs | midPx, premium, impactPxs all present | all three null |
That last row is the useful one. The info endpoint documentation explains why a price survives: for allMids, if the book is empty, the last trade price is used as a fallback. An empty book is precisely what a delisted market has. The fallback is doing its job, and the job it does is to keep a dead market looking alive.
So there are two ways to separate the rows, and both are cheap. Read isDelisted off the universe, or check whether midPx is null. A row where the mid price is absent and the mark price is present is a market with no book.
What a screen gets wrong
Here is the concrete failure. Sort all 234 rows by maximum leverage, descending, and take the top five:
| Rank | Market | Max leverage | |---|---|---| | 1 | BTC | 40x | | 2 | ETH | 25x | | 3 | MATIC | 20x | | 4 | SOL | 20x | | 5 | RNDR | 20x |
MATIC and RNDR were delisted. SOL is not, and on a live-only list SOL is third. Two settled markets have been occupying slots above it.
It is not a rare edge. A filter of maxLeverage >= 10 returns 41 rows, of which 7 are delisted: MATIC, RNDR, FTM, MKR, LOOM, TON and STRAX. The live count at that threshold is 34. Roughly one row in six of that screen cannot be traded.
The distribution, once the dead rows are gone
The tier structure changes when the 56 are removed. Here is the live-only table, with the maximum market order value each tier accepts under the contract specifications.
| Max leverage | Markets | Share of 24h volume | Share of open interest | Max market order value | |---|---|---|---|---| | 40x | 1 | 40.5% | 26.1% | $30,000,000 | | 25x | 1 | 19.2% | 24.1% | $30,000,000 | | 20x | 2 | 5.9% | 7.6% | $5,000,000 | | 10x | 30 | 29.0% | 33.2% | $2,000,000 | | 5x | 56 | 3.3% | 6.3% | $500,000 | | 3x | 88 | 2.1% | 2.8% | $500,000 |
Grouped by the order-value tier instead of the leverage number, the shape is starker. The two markets that accept a $30,000,000 order carry 59.7% of the venue's 24-hour volume and 50.2% of its open interest. The 144 live markets whose ceiling is $500,000 carry 5.4% of the volume and 9.0% of the open interest between them. That is 80.9% of the tradeable list capped at half a million dollars per market order.
Live markets turned over $5.94bn in 24 hours against $12.55bn of notional open interest, a ratio of 2.11. The top five markets by volume carry 79.3% of it.
Why the ratio matters more than the count
There is a second way this same list produces a wrong number, and it is worth stating because it is easy to repeat.
The openInterest field is denominated in the base asset, not in dollars. BTC reports 39,663.59, which is 39,663.59 BTC, worth about $3.28bn at the snapshot mark price. Summing that field across all 234 rows returns 88.17bn. That figure is not dollars and it is not comparable to anything, because it adds 39,663 BTC to 206,298,094 XRP to 73,075,408 SUI. Divided by 24-hour volume it produces a ratio of 14.8, which looks like a finding about capital depth and is an artifact of adding unlike units. Multiply each row by its own mark price first and the ratio is 2.11.
Both numbers come from the same payload. Only one of them means anything.
A correction to two of our own pieces
This is not a hypothetical. We made both mistakes.
The article The leverage cap is also an order-size limit reports that 193 of 234 markets cap at under 10x, and that those markets are 82.5% of everything listed. Both figures were computed over the raw universe, so both include the 56 delisted rows. The live-only figures are 144 markets and 80.9%. The mechanism in that piece is unchanged, and it is the part worth reading. The two counts were wrong.
An earlier piece, 234 perps, five markets, describes the 56 empty markets as possibly day-old listings: "a market listed last week is not broken, it is new." That is the wrong reading. All 56 carry isDelisted: true. None is a new listing. The venue's listing count is inflated by settled markets, not by recent ones.
The rule
Before you screen a venue by anything, drop the rows the venue has already retired. Read the delisting flag, or read the fields that go null when a book empties. It is one filter, and without it a leverage ranking, a volume share and an open-interest total all inherit the same 56 dead rows.
Then check the order-value ceiling for the market you picked, because on this venue that ceiling and the leverage cap are the same parameter, published in the same table.
Both habits cost nothing and they change the ranking.
JW3 is a non-custodial trading terminal. It routes to venues, it does not hold your keys, and its agent proposes actions that you approve and sign yourself.