
The maths of a losing streak
A 70% win rate does not protect a position sized at three times the arithmetic it can carry. Ruin is set by the size of the losing streak your size allows, not by how often you are wrong. What fixed-fraction sizing does to a drawdown, why doubling after a loss reaches zero in nine steps, what volatility targeting actually targets, and the gap risk no sizing rule touches.
Aún no está en tu idioma — mostrando inglés.
A strategy can win seven trades in ten and still be one bad week from zero. Those two statements are not in tension, and the arithmetic that connects them is short enough to check on paper.
The thing that decides whether you survive is not your hit rate. It is how deep the position you are allowed to hold lets equity fall before the next trade has to be taken. Win rate is a property of your view. Losing-streak tolerance is a property of your sizing, and it is set before the first trade.
What fixed-fraction sizing actually commits you to
Bet a fixed fraction f of current equity on every trade, with each loss costing exactly f. After n consecutive losses, equity is W0 · (1 − f)^n. That is the entire consequence of the rule, and it has nothing to do with whether the losses were deserved.
The table below is my own derivation from that expression, not a figure taken from any source. It is the number of consecutive losses required to reach a given drawdown.
| Risk per trade f | Losses to halve equity | Losses to lose 90% | |---|---|---| | 1% | 69 | 230 | | 2% | 35 | 114 | | 5% | 14 | 45 | | 10% | 7 | 22 | | 20% | 4 | 11 | | 30% | 2 | 7 | | 50% | 1 | 4 |
Read the 10% row twice. Seven losses in a row takes you to 47.8% of starting equity, and you need 22 of them to be down 90%. The rule is entirely predictable. What it buys is nothing about your view, only a statement about which losing streaks you can survive.
This is also why a "small" number feels different at the wrong point in the cycle. A 1% risk is one trade out of a hundred by a drawdown measure that counts dollars, and it is 5.9% of your remaining equity after six losses in a row.
The 70% win rate that loses money
Now the case that motivates the piece. Take a system with a genuine edge: 70% of trades win 0.5R, 30% lose 1.0R. The arithmetic expectancy is positive. Kelly's formula, in the form Wikipedia gives as f = p/l − q/g, returns exactly 0.10, so ten percent of equity per trade is the log-optimal size for those numbers.
Everything below this is my own derivation using the formula Wikipedia states.
| Size | Arithmetic per trade | Geometric per trade | After 7 losses | |---|---|---|---| | 10% (Kelly) | +0.50% | +0.25% | 47.8% of equity | | 30% (3x Kelly) | +1.50% | −0.91% | 8.2% of equity |
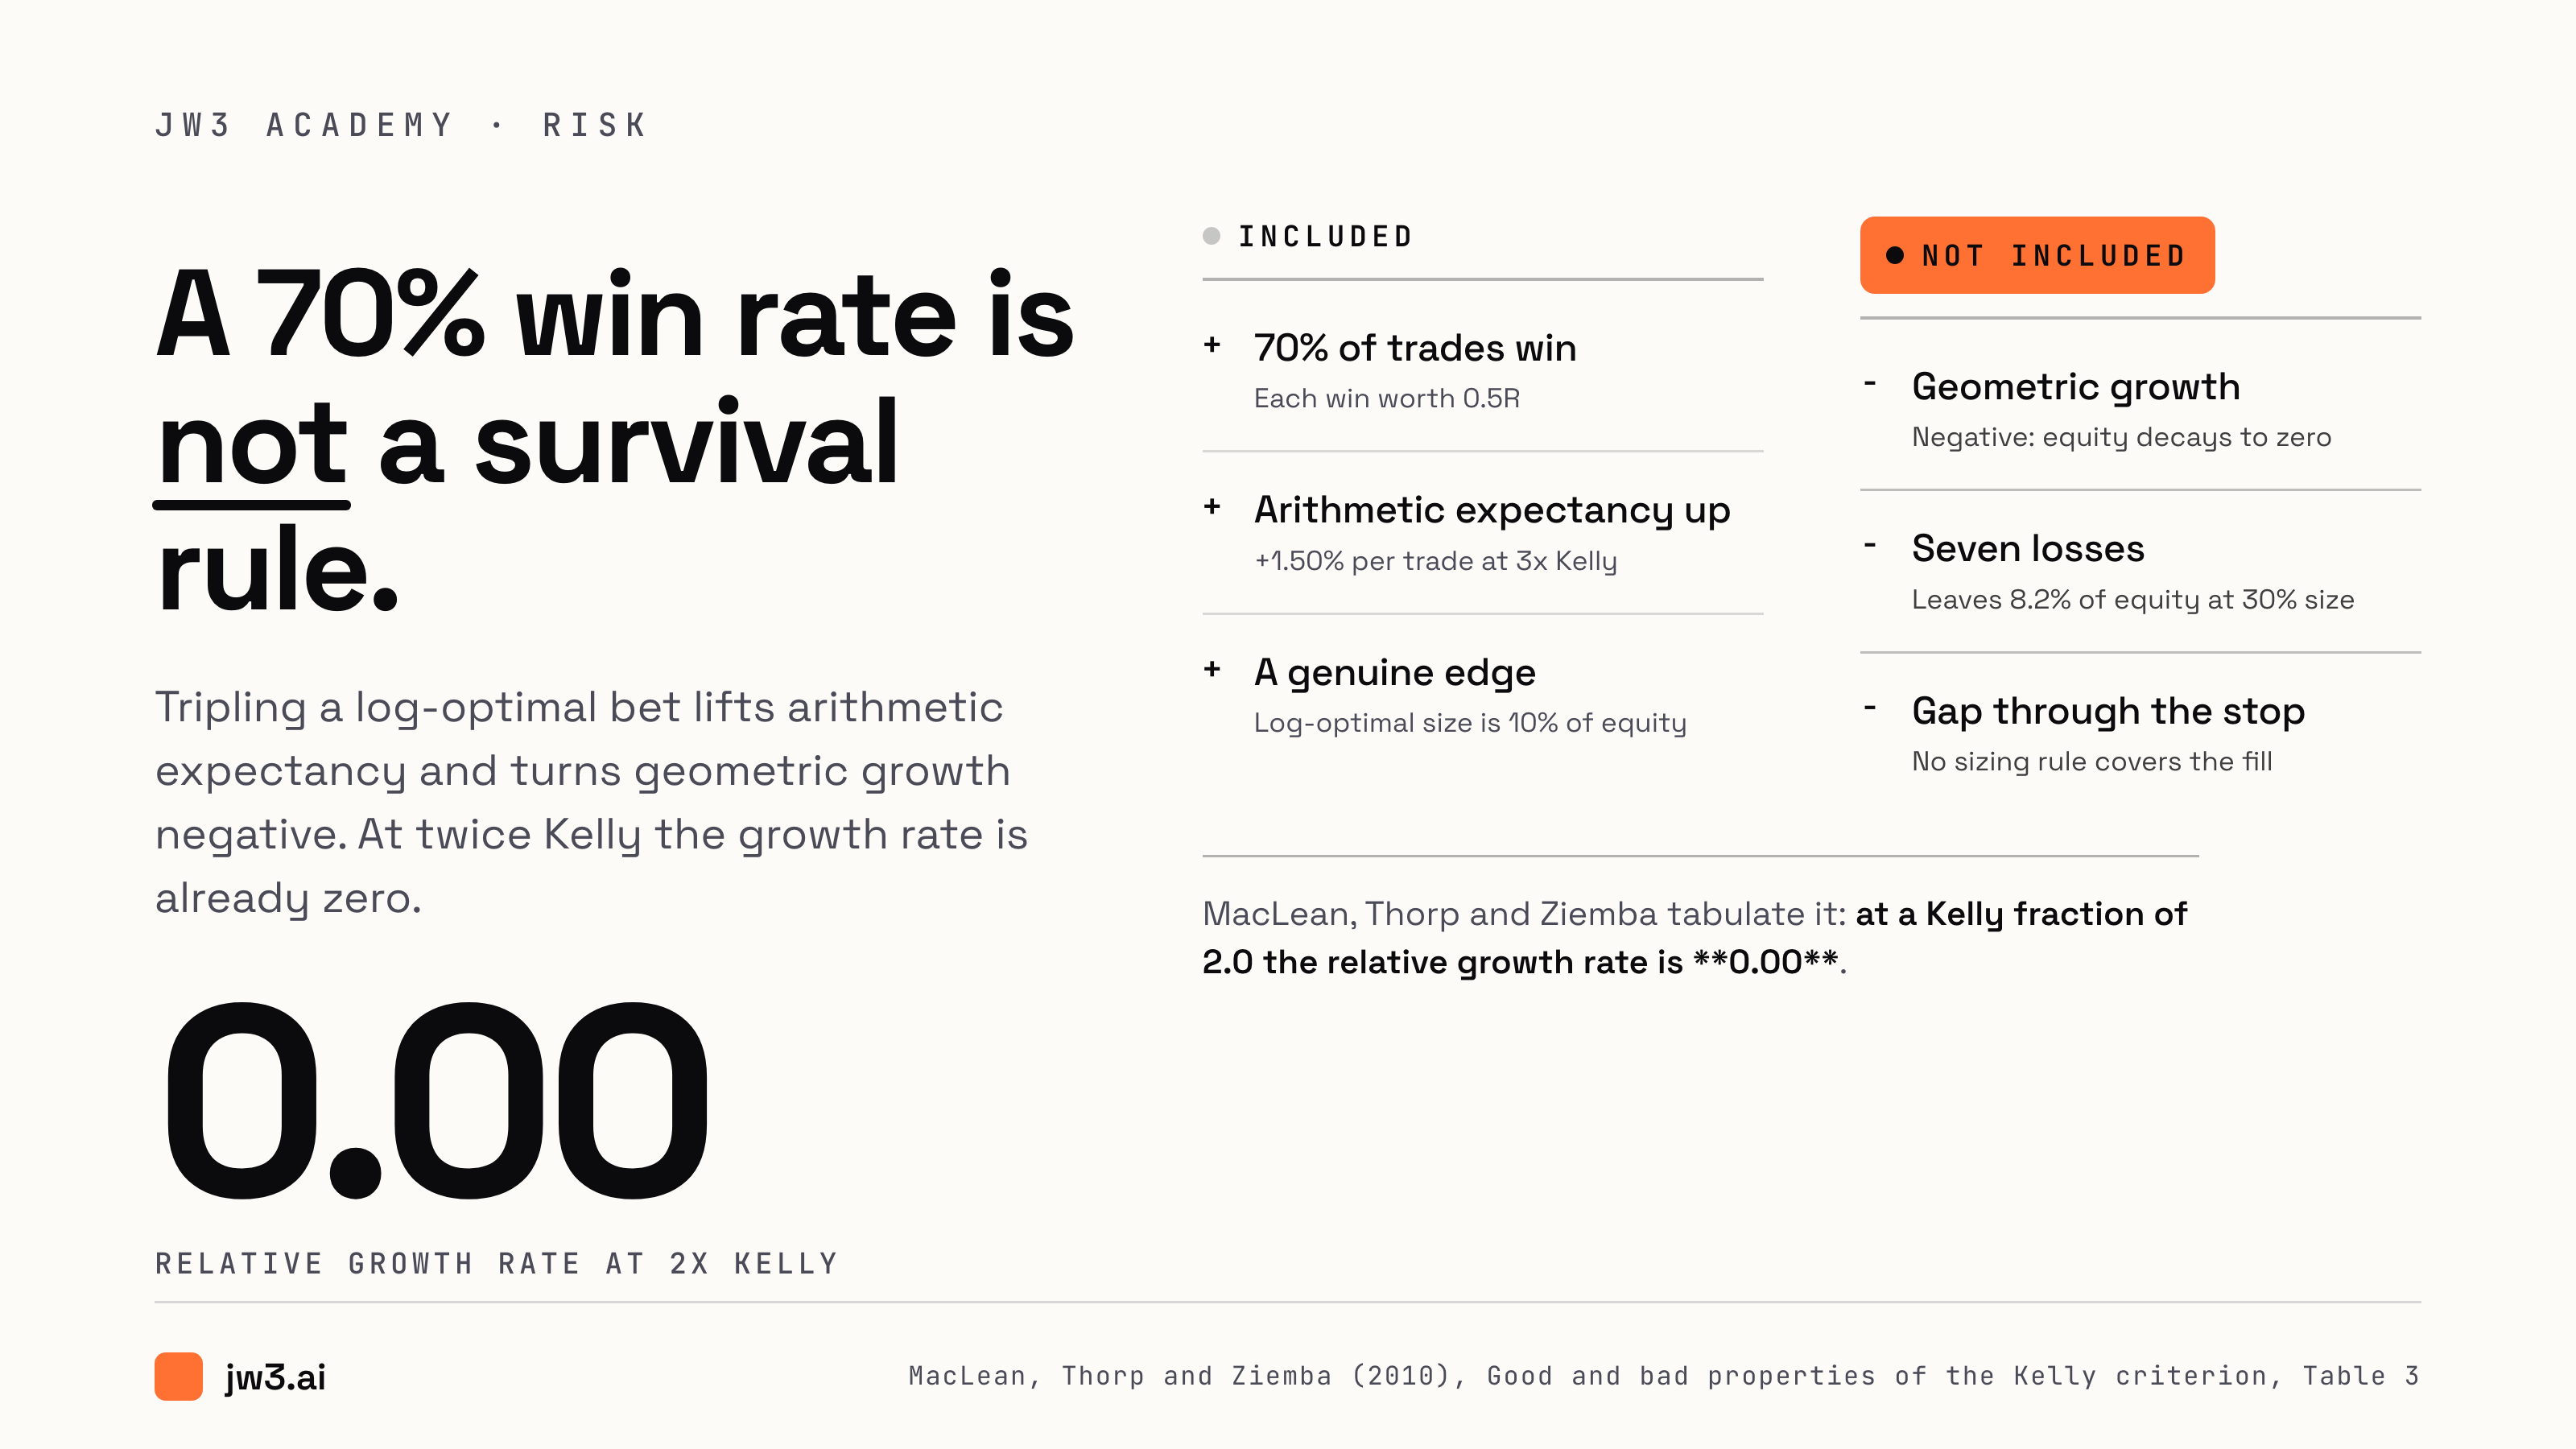
The second row is the one to sit with. Tripling the bet triples the arithmetic expectancy, from +0.50% to +1.50% per trade, and turns the geometric growth rate negative. A negative geometric growth rate means the equity curve declines towards zero no matter how many trades follow, and it is the quantity that decides survival, not the arithmetic mean.
It is the same conclusion MacLean, Thorp and Ziemba reach in Good and bad properties of the Kelly criterion, the paper Wikipedia cites for the risk-of-ruin claim. Their Table 3 simulates blackjack at p = 0.51:
| Kelly fraction | P[doubling before halving] | Relative growth rate | |---|---|---| | 0.1 | 0.999 | 0.19 | | 0.5 | 0.89 | 0.75 | | 1.0 | 0.67 | 1.00 | | 1.5 | 0.56 | 0.75 | | 2.0 | 0.50 | 0.00 |
At twice Kelly the relative growth rate is zero. Past twice Kelly the expected growth rate goes negative, which is the arithmetic statement that the strategy eventually goes broke.
Two further lines from the same paper apply directly to sizing a position that stays open. They list as a good property that "the ElogX bettor never risks ruin," and as a bad property that "the unweighted average rate of return converges to half the arithmetic rate of return." And on the fixed-fraction mechanism itself:
For coin tossing, any fixed fraction strategy has the property that if the number of wins equals the number of losses then the bettor is behind. For n wins and n losses and initial wealth W0 we have W2n = W0(1−f²)^n.
That identity is the asymmetry underneath every drawdown on a chart. Even money on both sides, an even record, and you are down. You do not need to be wrong to lose. You need to be wrong often enough while the position is large, and the asymmetry means recovery is slower than loss at every size.
The arithmetic expectancy is not the return you receive
The gap between the two columns in my 70% table is not a rounding effect, and it is worth naming precisely, because it is where most of the variance in realised outcome comes from.
At 10% sizing, arithmetic expectancy is +0.50% per trade and the geometric rate is +0.25%. You keep about half of what the average trade suggests you keep, on the good side of the average, and the shortfall is the variance tax. Wikipedia states the same effect in its worked coin example, where 20% of bankroll on a coin landing heads 60% of the time gives "a 2.034% average gain each round" against an arithmetic rate of 4%. I checked that figure against the formula Wikipedia derives. The log rate is 0.0201355 per round, and compounding it over 300 uncapped rounds takes $25 to $10,504, consistent with the $10,505 the article reports.
Halving your size roughly halves the drawdown per losing streak and cuts the geometric rate. That is the actual trade, and MacLean, Thorp and Ziemba state the reason fractional Kelly is standard practice: gamblers "would use less than full Kelly in order to reduce the chance of ruin, reduce volatility, and account for model error." Wikipedia's own caution is blunter, that when a gambler overestimates their true probability of winning, the computed criterion diverges from the optimal and the risk of ruin rises with it.
Doubling after a loss reaches zero in nine steps
Martingale sizing is the one approach that removes drawdown arithmetic entirely, because it never holds a losing position. That is its appeal and its trap, and the trap is arithmetic rather than psychological.
This is my own derivation. To recover a loss of 1 unit, the required cumulative risk is 2^N − 1. Against a $1,000 account starting at a $1 base stake, the sequence of stakes 1, 2, 4, 8, 16, 32, 64, 128, 256 is fully fundable, putting $511 at risk. The tenth step requires $512, and only $489 remains, so the sequence is unfundable at step 10. To win one dollar by doubling you must survive a run of nine consecutive losses.
That is the whole of it. The 70% example above gives a 1-in-4,572 chance of a seven-loss run, and even that rare run leaves you needing 18 winning trades at +0.5R to get back to where you started. Apply the martingale identity to that drawdown instead: recovering 91.8% loss requires risking about 3.1 times your base stake to win one unit. At a 30% base and an account under $5,000, the third step is unfundable before the first trade is placed.
Martingale fails the ruin test because the required capital grows without bound while the probability of the run that triggers it does not. Sizing that grows your risk in response to losses converts a survivable drawdown into an existential one, and no amount of edge protects the step that is not fundable.
What volatility targeting actually does
Volatility targeting sizes on the variance of returns rather than on the distribution of wins and losses. It is widely treated as the sophisticated answer to position sizing, and it does one real thing well: it equalises position size across instruments with different volatility, so a 2% daily move and a 0.5% daily move get the same risk weight.
What it does not do is bound anything. It is a normaliser, not a limit. My own derivation: at a 1% per-trade risk budget, a 3-sigma daily move costs 3% of equity, a 5-sigma move costs 5%, and a 10-sigma move costs 10%. The formula is linear in the move, so the tail of the distribution passes through it undamped. A rule that scales risk up when volatility is already extreme is making its largest bet into the part of the distribution it can least estimate.
Its honest boundary is the standard one. Wikipedia, citing Thorp and Rotando's American Mathematical Monthly paper, gives the growth-optimal fraction for an equity portfolio as f = (μ − r)/σ², and works an example with 6% excess return and 15% volatility. That Sharpe ratio is 0.40, the implied fraction is 267%, and the article notes the market itself appears to run at about 37.5% of it. Both the 267% and the 37.5% are above any level most accounts could survive a losing streak at. The optimisation is correct and the boundary is separate from it.
The gap no rule covers
Everything above assumes your loss is exactly f and fills exactly at your stop. That assumption is the load-bearing one, and it is the one a leveraged position cannot make.
A stop is a resting instruction. It executes only if there is a resting order to hit it at your price. A gap means there is not, and your fill is at whatever price the market offers next. On a 20x perpetual a 1% adverse move is roughly a 20% equity loss before any of this matters, so the size of the gap is a direct multiplier on the gap risk you cannot size away. Size down enough to survive a gap and you are trading a position too small to clear costs on a good day.
The CFTC states the mechanism without needing to say anything about your stop. In its Customer Advisory on retail forex it notes that "a 2 percent margin requirement means you could open a $100,000 position with only $2,000 in your account," that "this high degree of leverage amplifies both gains and losses," and that "you may also be liable for additional losses beyond your initial deposit." The same advisory reports that about two thirds of customers at registered OTC forex dealers lost money, based on accounts disclosed from Q2 2021 through Q1 2022. High win rate is common in that population, and two thirds of them are still down.
The same asymmetry shows up in a market that is not a perpetuals market at all. Loesch, Hindman, Richardson and Welch analyse 17 Uniswap v3 pools in *Impermanent Loss in Uniswap v3*, covering 43% of TVL, and find total fees earned of $199.3m against total impermanent loss of $260.1m, so those providers "would have been better off by USD 60.8m had they simply HODLd." Their mechanism is concentrated range width rather than a stop, and the paper's framing is precise: leveraged liquidity provision is a reduced trading range achieving higher capital efficiency by eliminating unused collateral, and "this leverage increases the fees earned, but it also increases the risk taken."
Nothing about that 60.8m was a bad call in the moment. It was a position size that could not carry the range of outcomes it was exposed to.
What a sizing rule can and cannot promise
State a capability and its limit in the same breath, because the two travel together.
A fixed fraction bounds how much a given losing streak takes from you, in a way you can compute before the streak arrives. Half Kelly and quarter Kelly reduce that bound and reduce your geometric growth rate, which is the trade being made. Volatility targeting normalises size across instruments and does not bound the tail.
No sizing rule removes gap risk. Kelly is derived under known probabilities and known outcome sizes, and Wikipedia says so directly, that the criterion is "perfectly valid only for fully known outcome probabilities, which is almost never the case with investments." Kelly's own 1956 paper makes the same assumption explicit: he sets aside the strategy of betting total capital, notes that doing so leaves the bettor "broke with probability one," and derives the fractional bet as the alternative. He is optimising a known game. The famous formulation that a gambler's capital can grow at the rate of information transmission is conditioned on bets being offered "at odds consistent with their probabilities," which is a statement about a fair game, not about a market that gaps.
The sizing question is therefore not whether your view is right. It is how many consecutive wrong answers your size lets you hold, and whether the account can fund the answer to that number when it arrives. A 10% rule needs you to be solvent through 7 losses and 22 to be down 90%. Check that your capital is still there at the 22nd, and remember that a stop does not keep that promise.
Risk note: cryptocurrency trading, leveraged perpetual futures, and automated algorithmic strategies carry significant risk of rapid and total financial loss. Never risk funds you cannot afford to lose completely. Position sizing bounds the cost of a losing streak under continuous execution and does not bound a gap through a stop order, an exchange failure, or a venue counterparty default; the historical loss rates cited here describe other products and markets and are not a forecast for any account. Nothing in this article is investment advice, a recommendation, or an offer to sell any product.